

Watch the film 🎞️
awarded from VILLUM FONDEN (Grant No. 54492)
in September 2023.
Research Pillars
The primary research conducted under the auspices of this Center will broadly focus on the following four key pillars.

Data Infrastructures

Flexible Visual Representations

Sensing and Interaction
Human Centered AI
Experimental Testbeds
And these pillars of research will be strengthened
by exploring them in the context of the following
three
testbeds.

Scientific Inquiry

Manufacturing

Higher Education
Featured Projects
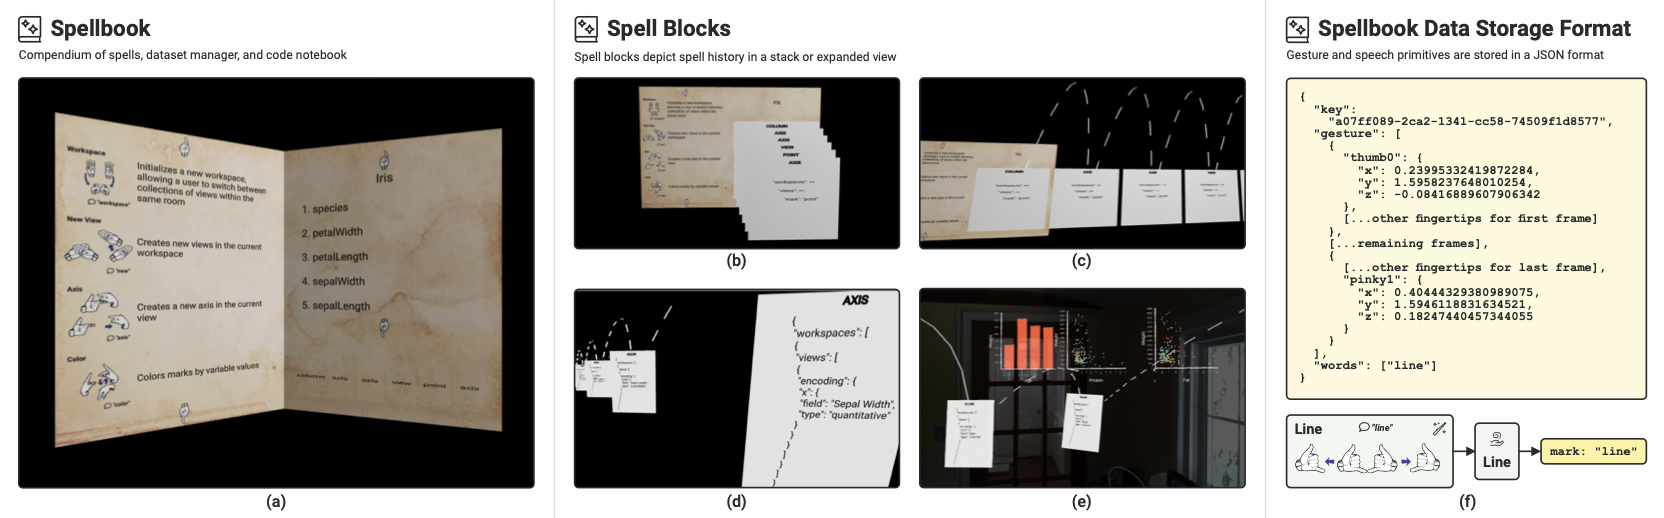
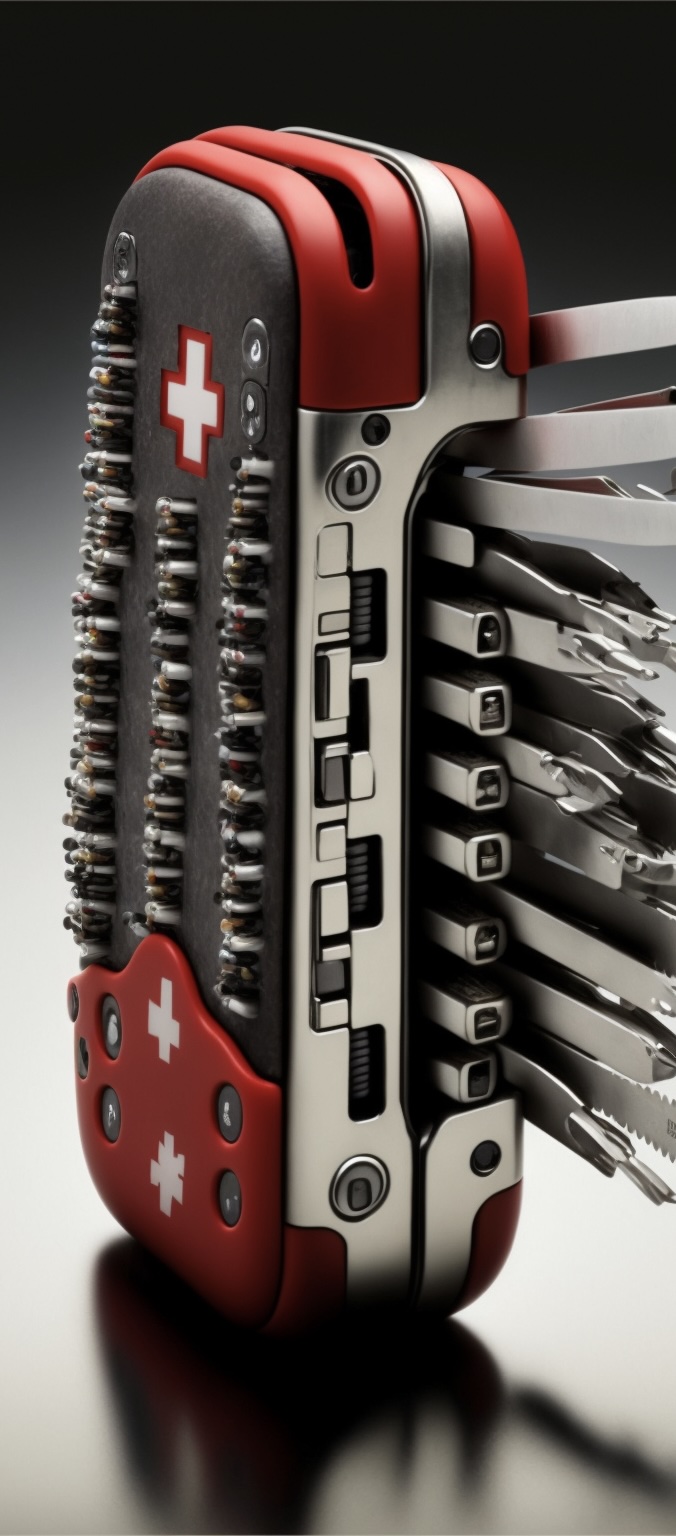
Wizualization: A “Hard Magic” Visualization System for Immersive and Ubiquitous Analytics
What if magic could be used as an effective metaphor to perform data visualization and analysis using speech and gestures while mobile and on-the-go?
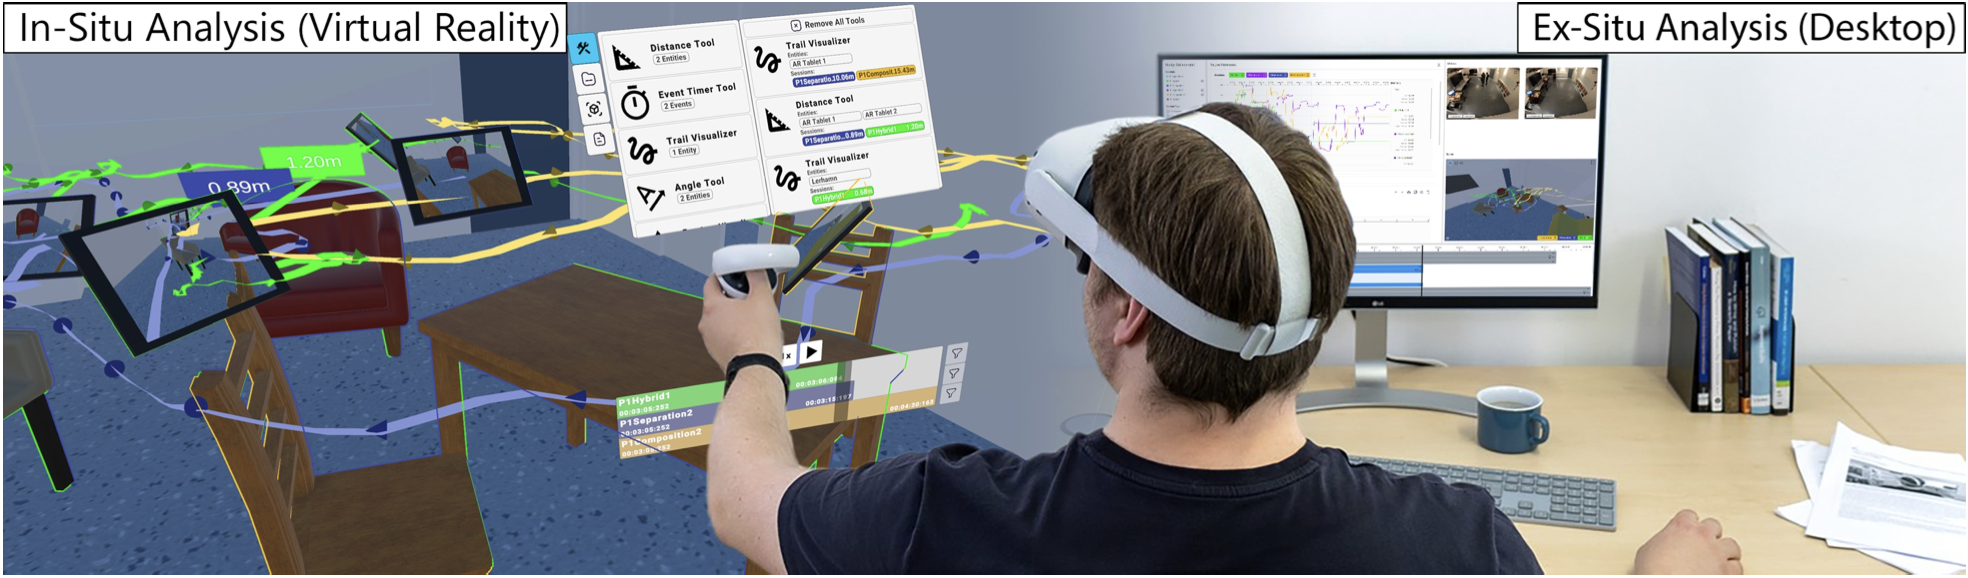
ReLive: Bridging In-Situ and Ex-Situ Visual Analytics for Analyzing Mixed Reality User Studies
Immersive analytics tools have recently emerged to support such analysis in situ, yet the complexity of the data also warrants an ex-situ analysis using more traditional non-immersive visual analytics setups. What if we can bridge these approaches?
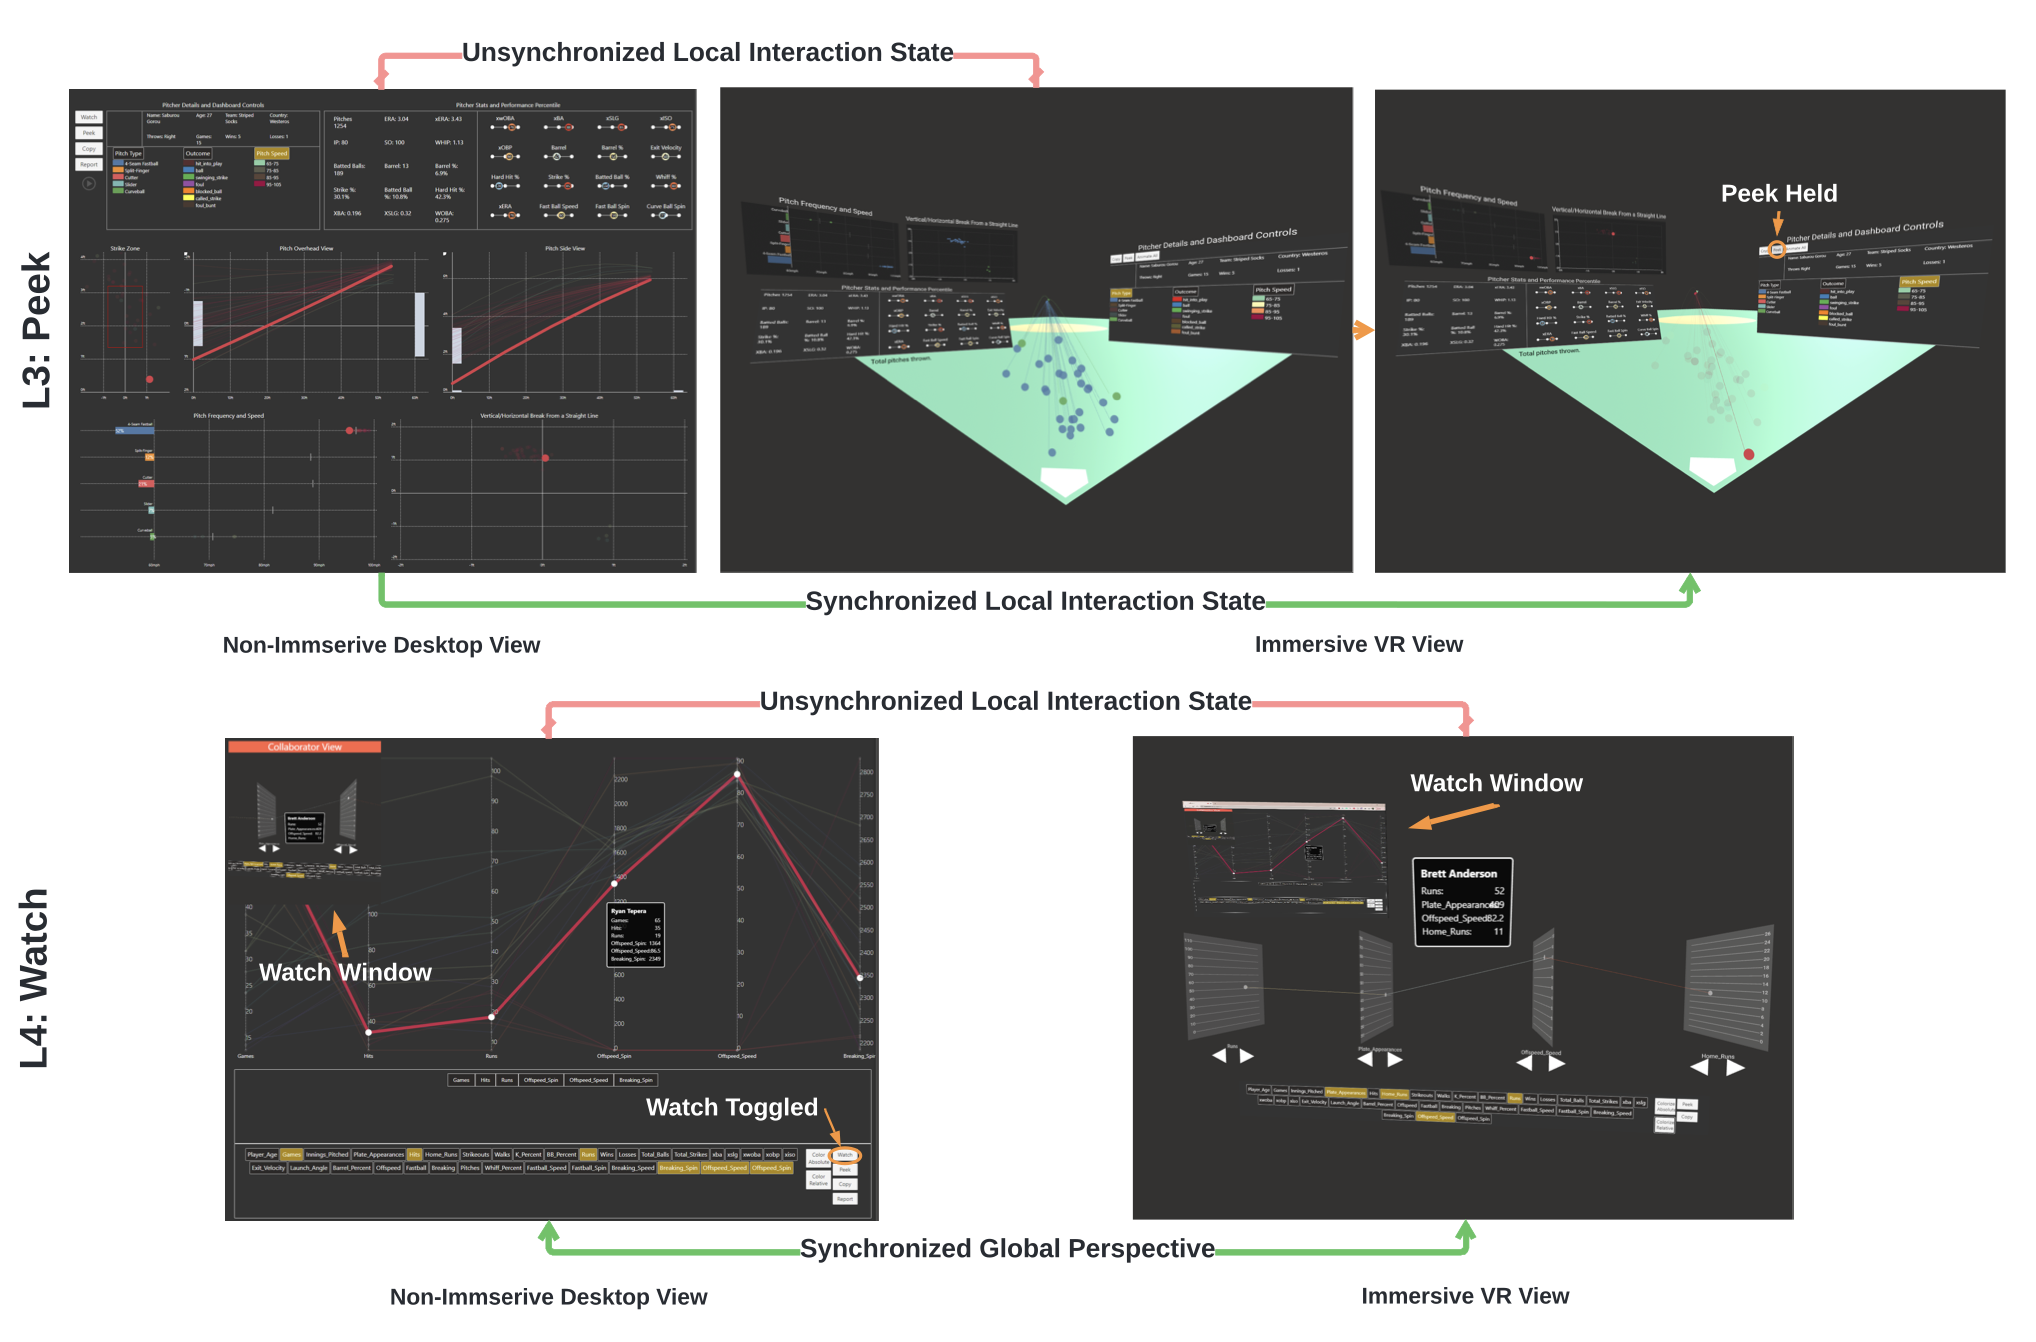
Through Their Eyes and In Their Shoes: Providing Group Awareness During Collaboration Across Virtual Reality and Desktop Platforms
Many collaborative data analysis situations benefit from collaborators utilizing different platforms. However, maintaining group awareness between team members using diverging devices is difficult, not least because common ground diminishes. A person using head-mounted VR cannot physically see a user on a desktop computer even while co-located, and the desktop user cannot easily relate to the VR user’s 3D workspace. But what if we can?
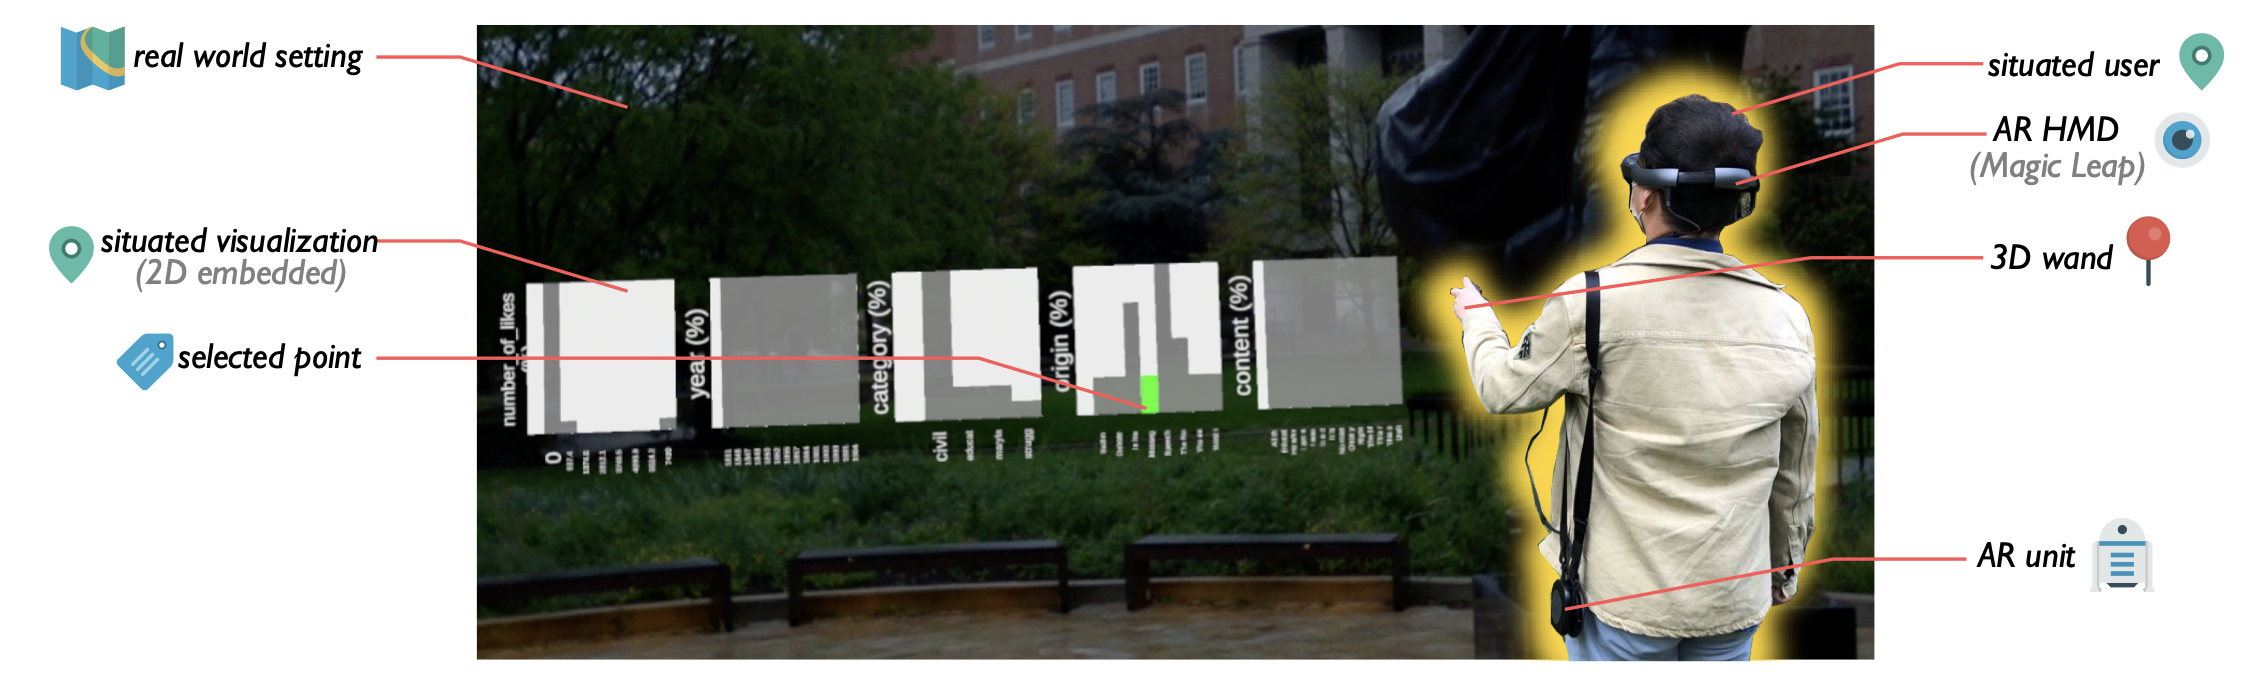
The Reality of the Situation: A Survey of Situated Analytics
The advent of low-cost, accessible, and high-performance augmented reality (AR) has shed light on a situated form of analytics where in-situ visualizations embedded in the real world can facilitate sensemaking based on the user’s physical location. However, what is the current state-of-the-art in this emerging field of situated analytics?
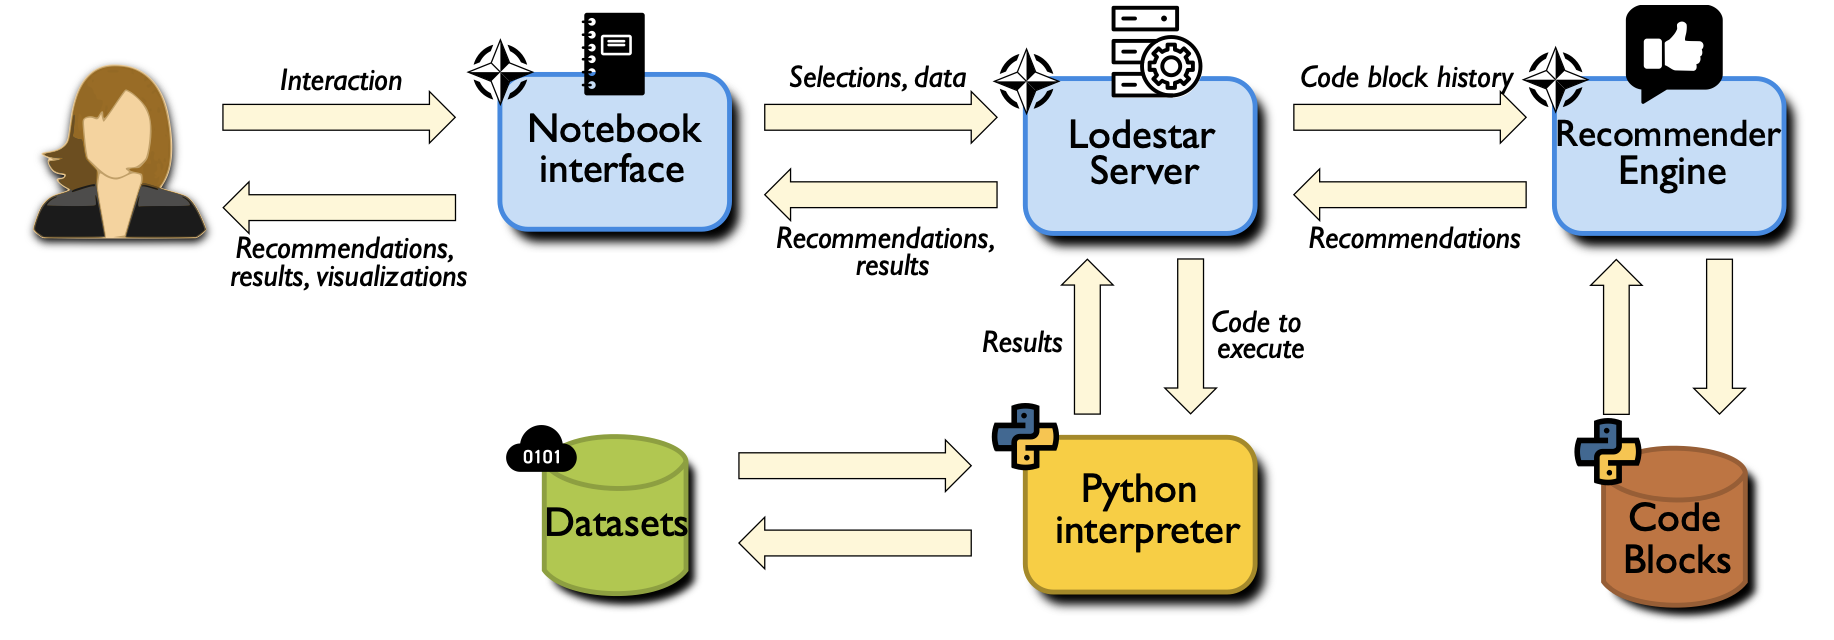
Lodestar: Supporting Rapid Prototyping of Data Science Workflows Through Data-Driven Analysis Recommendations
Keeping abreast of current trends, technologies, and best practices in visualization and data analysis is becoming increasingly difficult, especially for fledgling data scientists. What if there was an interactive computational notebook that allowed users to quickly explore and construct new data science workflows by selecting from a list of automated analysis recommendations?
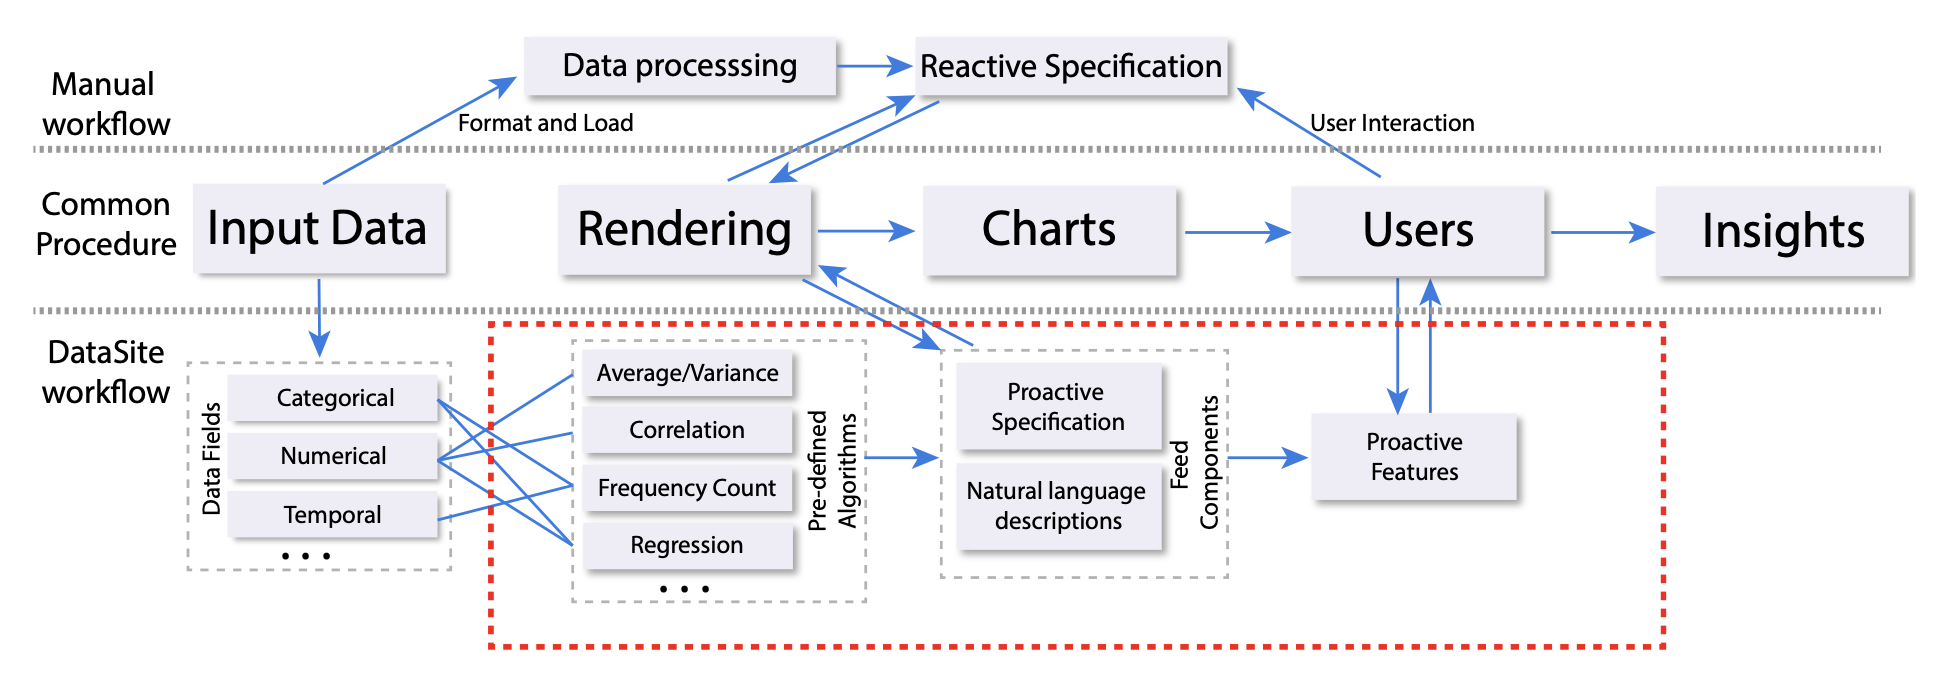
DataSite: Proactive Visual Data Exploration with Computation of Insight-based Recommendations
Effective data analysis ideally requires the analyst to have high expertise as well as high knowledge of the data. Even with such familiarity, manually pursuing all potential hypotheses and exploring all possible views is impractical. What if, a visual analytics system was proactive in taking the burden of selecting and executing appropriate server-side computations?
Scientific Inquiry
Manufacturing
Higher Education
Wizualization: A “Hard Magic” Visualization System for Immersive and Ubiquitous Analytics
What if magic could be used as an effective metaphor to perform data visualization and analysis using speech and gestures while mobile and on-the-go?
ReLive: Bridging In-Situ and Ex-Situ Visual Analytics for Analyzing Mixed Reality User Studies
Immersive analytics tools have recently emerged to support such analysis in situ, yet the complexity of the data also warrants an ex-situ analysis using more traditional non-immersive visual analytics setups. What if we can bridge these approaches?
Through Their Eyes and In Their Shoes: Providing Group Awareness During Collaboration Across Virtual Reality and Desktop Platforms
Many collaborative data analysis situations benefit from collaborators utilizing different platforms. However, maintaining group awareness between team members using diverging devices is difficult, not least because common ground diminishes. A person using head-mounted VR cannot physically see a user on a desktop computer even while co-located, and the desktop user cannot easily relate to the VR user’s 3D workspace. But what if we can?
The Reality of the Situation: A Survey of Situated Analytics
The advent of low-cost, accessible, and high-performance augmented reality (AR) has shed light on a situated form of analytics where in-situ visualizations embedded in the real world can facilitate sensemaking based on the user’s physical location. However, what is the current state-of-the-art in this emerging field of situated analytics?
Lodestar: Supporting Rapid Prototyping of Data Science Workflows Through Data-Driven Analysis Recommendations
Keeping abreast of current trends, technologies, and best practices in visualization and data analysis is becoming increasingly difficult, especially for fledgling data scientists. What if there was an interactive computational notebook that allowed users to quickly explore and construct new data science workflows by selecting from a list of automated analysis recommendations?
DataSite: Proactive Visual Data Exploration with Computation of Insight-based Recommendations
Effective data analysis ideally requires the analyst to have high expertise as well as high knowledge of the data. Even with such familiarity, manually pursuing all potential hypotheses and exploring all possible views is impractical. What if, a visual analytics system was proactive in taking the burden of selecting and executing appropriate server-side computations?
Yet there's more to speak →
Our Team

Director
6
Current Members
33
Alumni
9
External Collaborators
Know more about them →
If you are interested in joining us, find more about our open positions here →